7.4. Trap Tab
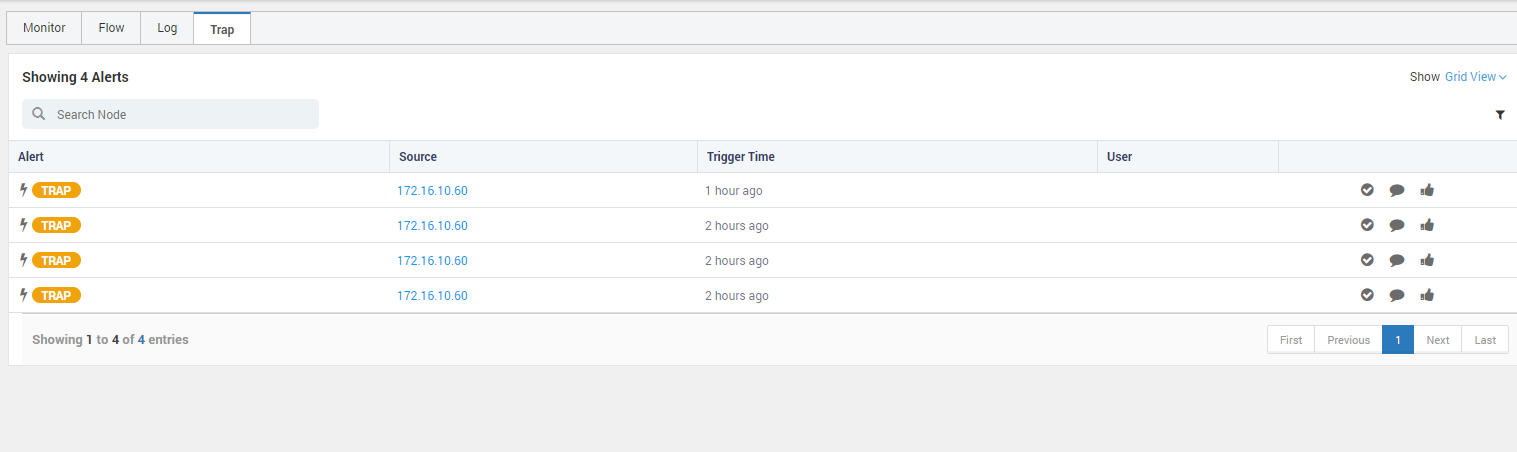
The tab specifically shows all the alerts that are related to traps only. The user interface of this tab is similar to the Flow and Logs tabs. However, you may find some options that are different from other alert-stream sections and specific to trap alerts.
Trap Alerts
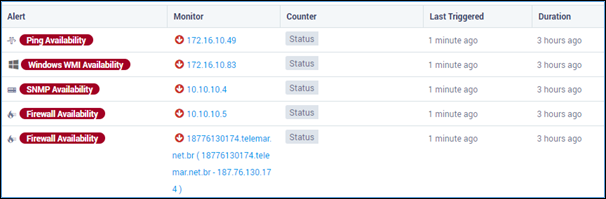
The list shows all the alerts of the traps from the last poll. The section shows the brief and important details of the alerts. Click on the alert name to see the complete details of the alert. The columns descriptions are as follows:
Column |
Description |
Alert |
Displays the name of the alert. |
Source |
Shows the host name/IP address of the monitor being monitored. |
Trigger Time |
Shows the last time when the alert was triggered. |
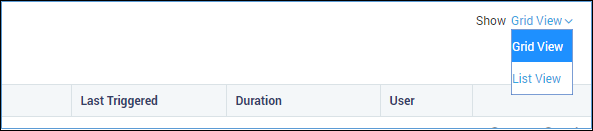
User |
When a user claims the alert, the username is displayed in the column. |
7.4.1. Alert Options
Alert options are the actions that you can perform towards the alert.
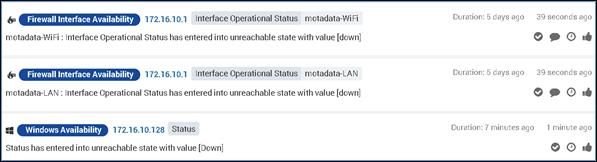
Clear Alert: Click on the icon to clear the alert. Clearing the alert means that the alert will not show until next poll. System will show you a popup to write a description (optional). System will also post a comment about details of the activity.
Post Comment: Click on the icon to add comments about the alert. The comment will be visible for all the alerts generated for that moflownitor. For example, if an alert of ‘Firewall Availability’ is generated from on 172.16.10.1 and user posts a comment: “SSH bad packet length. The length parameter is increased to 2^6”, on that particular alert then this comment will be visible only to that alert (unlike comment on monitor where a comment is visible on all the other alerts generated for the 172.16.10.1).
Claim Alert: Click on the to claim an alert. One alert can be claimed only by one user. System will show the username of the person who is claiming the alert in ‘user’ column. System will post a comment about the activity.
View Ticket: When a ticket is generated for the alert, you’ll see an eye icon. Click on the icon to see the ticket generated for the alert. A ticket is generated when ‘Trouble Ticket’ action is configured in system and assigned to the alert.
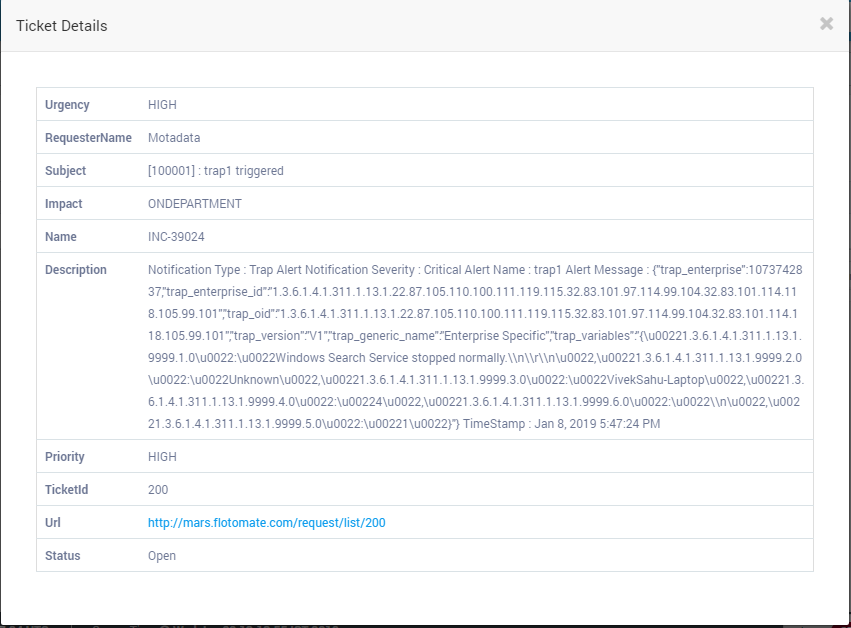
View Ticket
7.4.2. Filters
By default the system do not show flow alerts in clear state. Use the filter option to see the alerts based on the filter conditions. The alerts can be filtered by:
Filter by Source: Select the source IP/Host name from the drop down. System will show alert streams only for selected sources.
Filter by Severity: Select the severity levels from the drop down. System will show alert streams for monitors for selected severity levels only.
Filter by Alerts: Select the name of the alert you want to see. System will show only selected alerts.
Filter by Time: Select the duration of the alert.